Tracking... it’s one of those math education buzz words. A trend. It comes, and it goes. With all the differing opinions and conflicting research, it is difficult to know whether or not tracking is a good thing. I have had experience teaching in three different school districts, all of which used a different method of tracking. Below is a brief account of each:
My first school district was quite small, and I was the only eighth grade math teacher for the general education population. I had one advanced class that learned high school Algebra 1. The rest of my classes had widely varying ability levels that quickly became apparent through the Pre-Algebra curriculum. I was very happy to have an advanced course, as those students were ready and eager to be challenged (a teacher’s dream). My other classes, though, were sometimes a struggle. I had low performing students, high performing students, and everything in between. As a first year teacher, I desperately wanted to meet the needs of all learners but felt that this was a next-to-impossible task.
After my first year of teaching, I decided to move closer to home. I also had the opportunity to teach high school math, which was (and still is) a passion of mine, in a slightly larger and more financially-stable school district. In the high school, there was one section of a team-taught class at each level: Algebra 1, Geometry, and Algebra 2. These courses were a mix of special education students and students that had a history of struggling with math. Although I never did a team-taught class, the stories I heard from my colleagues sounded more like nightmares. (Unfortunately, behavior issues often come along with lower achievement levels.) Meanwhile, I again struggled with the issue of varying needs from my students. While I was gaining confidence with differentiating, I always felt that my bright students were being held back, never really pushed. This couldn’t be the best way, could it?
This year I am continuing my career at what will hopefully be my home district for many years to come. I am still teaching high school math, as well as some junior high science. My district is quite large, and we are fortunate to have the generous support of our community. With such a large high school comes more of an opportunity for tracking. In fact, we have three levels: A track (high performers), B track (struggling learners), and C track (team-taught/special education). There are also resource room math courses. After my dilemma of trying to meet the needs of all learners, I was excited to see if this might be the answer. An interesting component, though, is that the Geometry courses at my school mix the A and B track students. The rationale is that this will give some students the chance to jump up to A track after a transition year, even if they struggled in junior high. Teaching the mixed Geometry courses along with the B track Algebra 1 course, I am surprised a bit at my findings. Although I have several “B” students in my Geometry classes, I feel that most of them are putting forth the effort necessary to keep up with their peers. A bar has been set, and most of the students are trying to reach it. However, in my B track class, many students are living up to the expectation that inevitably goes with this lower level. I see lower rates of homework completion, less seeking of help, and more behavior issues.
In conclusion, I have been unable to make any conclusions! I don’t think that there is a right or wrong way when it comes to tracking math students at the secondary level. Unfortunately, I feel that no matter which method is chosen, some students will get the “short end of the stick.” The question is, who can we justify that to be?
At the beginning of my work this week, I was really struggling with the idea of a locus and how to create a drawing, either by hand or on Geogebra. There are of course some simple loci that I am very familiar with: a circle, a perpendicular bisector of two points, etc. However, I was struggling to apply this concept to more complicated situations that involved conics. I also felt very limited in my explorations because my GGB knowledge is quite minimal.
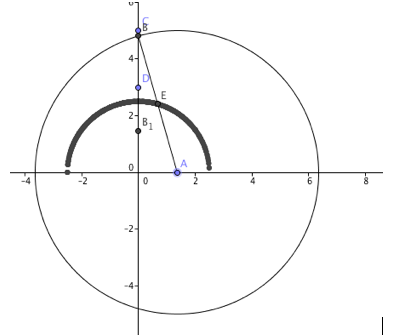
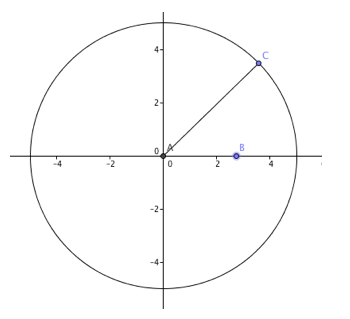
After finding this youtube video, I was at least able to reconstruct one example of a locus (see below). Without any verbal instructions as to how to create the drawing, I looked at the video of the GGB sketch and observed how certain components of the figure changed as point A slid along the x-axis. Here were my steps in reconstructing the drawing:
- I made a new point, A, on the x-axis.
- Then I defined a circle with center A of radius 5.
- Next, I made point B - the intersection of the circle and the y-axis.
- My next step was to create the midpoint, E, of radius AB.
- Lastly, I turned on the trace feature for midpoint E.
By sliding point A along the x-axis, the locus was traced by point E in the form of a semicircle. This is intuitive because the distance AE has a fixed length of 2.5. As point A is moved, point B has to move as well to maintain the correct radius and remain on the y-axis. The equation that shows how A and B are related is as follows: (A-0)^2 + (B-0)^2 = 5^2 = 25. Also, since AB is a radius, A must maintain a domain of -5 < x < 5. After gaining a little confidence, I used a picture from this website to create another GGB locus drawing.
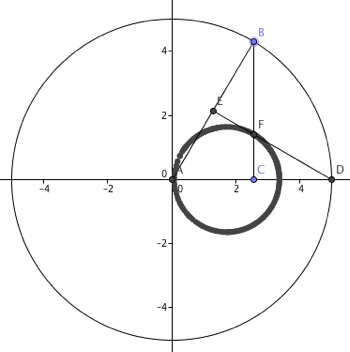
- This time, I started with a circle of fixed radius 5 centered at the origin.
- I then created point B on the circle and point C on the x-axis.
- To follow were segments AB and BC.
- Then I created point D, the intersection of the circle and the x-axis, which occurred at (5, 0).
- Point E is the midpoint of AB.
- Next I created segment DE.
- Point F is the intersection of BC and DE.
Turning the trace feature on for point F and dragging point B all the way around the circle, I found that the locus turned out to be a smaller circle inside the larger one.
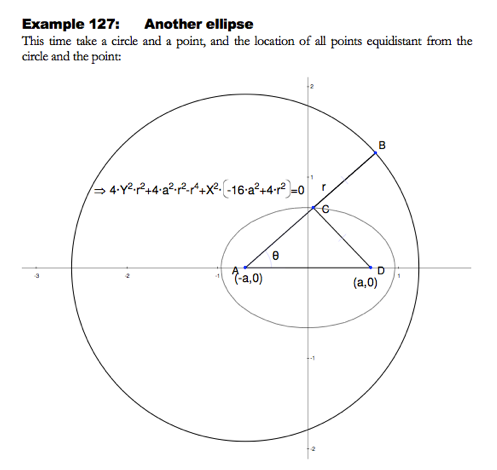
Here is another sketch from the same website that I was attempting in Geogebra (without success):
For this sketch, I felt I needed to use the locus tool so that I could trace the set up points equidistant from the circle and point D. After a bit of experimenting, I still couldn’t get it to work. This is as far as I got: All in all, I am feeling much more confident with loci. After making a couple of sketches, I am more open to experimenting. Finding the shapes that the set of points in a locus produce is quite fascinating! I would enjoy studying this at greater depth in the future.
Prof. Golden: I would appreciate some feedback regarding how to use the locus tool on GGB. I know we worked with this some last week in class, but I am not able to reproduce it on my own. Thank you!
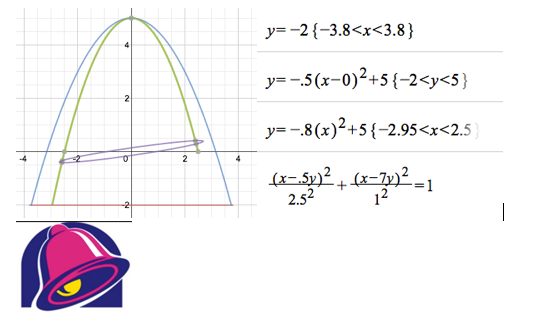
In MTH 641 this past week, we spent some time on conic sections. I have always found them to be fascinating. Only a slight change in an equation can result in a completely different graph! Not to mention how they are all cross-sections of a cone. Despite this, students sometimes struggle to find that same fascination and excitement. After reading the article “Draw It, Write It, Do It” by Leapard and Caniglia, I was inspired to make see if I could make conic sections more meaningful for my students with conic art. Below is my first attempt at making a picture out of conics sections, and the equations that I used. My first idea was to make the Taco Bell logo (also below). Here were my steps:
- Make the bottom horizontal line. This was very simple. I knew I just needed to make an equation in the form of y=k.
- Next I made the blue parabola. I knew it needed to be opening down with a y-intercept a decent distance above my horizontal line. I decided to keep it symmetric about the origin.
- Next I decided to restrict the domains of each of these functions to resemble the taco bell logo. This took a bit of experimenting in order to find that point of intersection (an advantage of using an automatic grapher rather than doing all of the algebra by hand).
- My next thought was to make another parabola. Since I didn’t know how to make a parabola with a “tilt,” I decided to simulate a tilt by restricting the right endpoint of the domain more than the left.
- My next idea was to create an ellipse, which I experimented with to get it centered and of the correct width. I knew I need to find way to actually tilt my ellipse to create an accurate representation. With a little research, I found that having a sum or difference of x’s and y’s in the numerator of the ellipse formula could create such an effect. After a bit of experimenting and not being able to shift my ellipse up or down, I decided a “non-tilted” picture might be a better place to start.
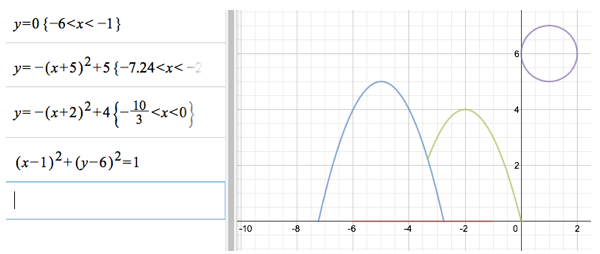
This time, I decided to draw my own picture for inspiration:
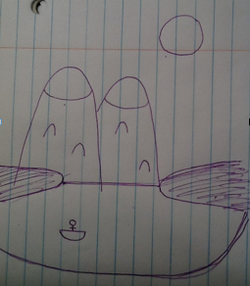
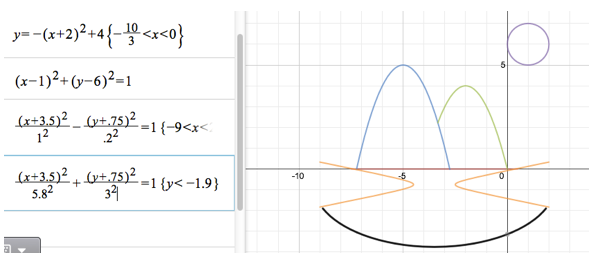
My strategy this time around was to make my equations as easy to manage as possible. Step 1: Horizontal line (water line); Step 2: Parabolas (mountains); Step 3: Circle (sun). Using the vertex form of the equations allowed me to not have to perform a lot of trial and error. Also, I used my graphing calculator to find the zeros of the parabolas, as well as their intersecting point. Here’s my start:
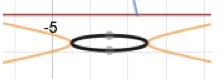 My next challenge was to create the hyperbola (tree line on both sides of the picture) and half-ellipse (lake). First, I tried to create a hyperbola centered at (-3.5, -1). This line the parabola up correctly, but I definitely had to play with the a and b values to make it narrow enough to resemble a tree line. I also realized it needed to be shifted up, as the tree line would have needed to be centered at y=0, not y=-1. For ease, I decided to “meet in the middle” at y=-.75. This simply required my to widen the restrictions for my horizontal water line. Next was the half-ellipse. As a starting point, I decided to try an equation for the half-ellipse identical to my hyperbola, only with a “+” instead of a “-.” It was interesting to see that this resulted in an ellipse that sat right in the middle of the hyperbola (see right). This was obviously too small, but was lined up right where I wanted it!
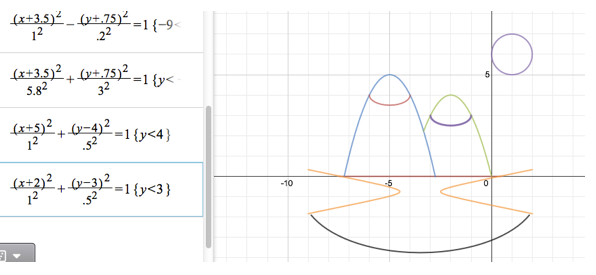
It was a simple adjustment: increase the a and b values to increase the size of the ellipse. I knew I needed the a-value to be larger than the b-value in order for the horizontal axis to be longer than the vertical axis. Below is my result:
Getting closer! My next step, I decided, had to be the partial ellipses to show the snow-capped mountains. Knowing the centers of each ellipse based on the picture, this went really quickly! I was also surprised that I could use whole numbers in my range restrictions.
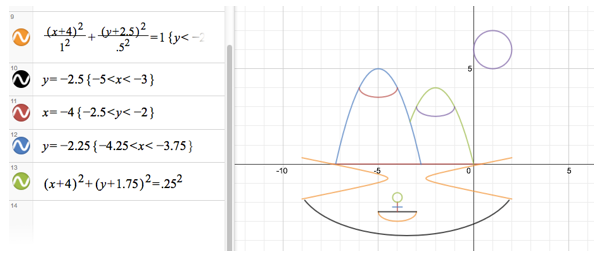
After looking at the rest, I decided to forget the mountain’s accent marks because I don’t think they add a lot to my picture and would have required an additional four equations. However, I was determined to get the man in the boat!
I used the same basic half-ellipse as I did for my snow capped mountains, simply changing the center. Then I made tiny horizontal and vertical lines for the man’s body, carefully selecting the restricted domain and/or range. The circle (head) also went smoothly as I was able to clearly visualize the center, as well as the size of the radius. It worked!
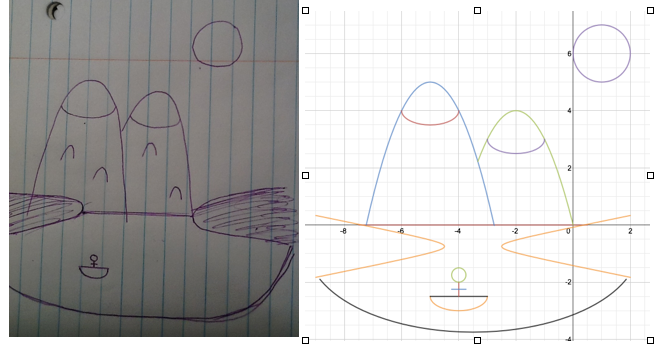
Overall, I was happy with how my drawing turned out. Now that I have had success creating a simple picture, my next drawing will be a bit more complex.
Final Side-by-Side Result:
My goal for my end-of-course project is to develop a mini-unit plan on Constructions. The geometry teachers in my math department have decided to spend approximately four class periods (one hour each) on constructions, including a summative assessment. I would like to incorporate some hands-on constructions, but also involve some technology in the form of Geometer’s Sketchpad (this is what we have used in the past) or Geogebra. Here are my thoughts for a general outline:
Day One:
I would like the students to do some comparing of the different hands-on ways to do constructions. I found a great resource that asks students to compare the following: miras, patty paper, and compass/straight edge. I really like this idea! However, I might eliminate the patty paper to save a bit of time and because my students are already familiar with using the miras. I’ll have to give this some thought. After doing our comparisons, the students will work on various compass and straight edge constructions, keeping a bulleted list of their steps in sequential order. I will model a couple at the start. Each student will be assigned a partner with a similar ability level. While the concept is still new, I like that students will be able to bounce ideas off of each other but that one person will hopefully not dominate the discussion.
Day Two:
This is going to be the Geometer’s Sketchpad/Geogebra day. I will need to spend some time going over the various functions in the program so that students will be able to take off and do some constructions on their own. I may create a short GS or GGB tutorial that repeats some of the constructions from the previous day as a warm-up. From there, I will have a self-paced activity that contains several new constructions. I’d like to research how to make my activity more creative than just having a list of constructions. One idea I have (that may or may not work) would be to have students take the shapes of their constructions and create some kind of picture out of them. (If students print their sketches, this might be something they can do at home.)
Day Three:
I’m not totally decided on what I would like to during this class period. I want to extend the students’ knowledge in an engaging way. Right now, the only idea I have is from Science vs. Magic. This constructions “game” does not allow the students to move to the next level without completing the construction on the current level (similar to a video game). However, with the range of abilities of the students in my classes, I may have to differentiate instruction and offer a couple of activities. I think some of my students would really struggle with this one without some extra support.
Day Four:
On the last day of the mini-unit, students will be given a summative assessment (probably a large quiz). I plan to spend the first half of the hour reviewing (perhaps going over the activities from Day Three) and the second half of the hour giving the assessment.
So that is a synopsis of what I've been tossing around in my head, but I have yet to start putting anything together. If anyone has some resources/activities to share, I would really appreciate it!
|
 RSS Feed